SAP transaction ST02 can be used to view SAP Buffer and memory configuration for a SAP instance and review SAP memory quotas for individual user job or process as well as current SAP buffer status, SAP memory utilization at SAP instance or user/transaction level.
1. How to run SAP Memory/Buffer monitor and navigate through important screens of the monitor
2. Explanation on SAP ST02 screens
3. SAP ST02 transaction and memory analysis
4. Further clarification
1. How to run SAP Memory/Buffer monitor and navigate through important screens of the monitor
1.1. How to start SAP Buffer/Memory monitor
To start SAP Buffer/Memory monitor, you can either use menu path or run sap transaction ST02 directly. This would show buffer/memory configuration and usage for the instance where the SAP ST02 is started. After you execute SAP transaction ST02, SAP buffer and memory overview/status screen would show up:
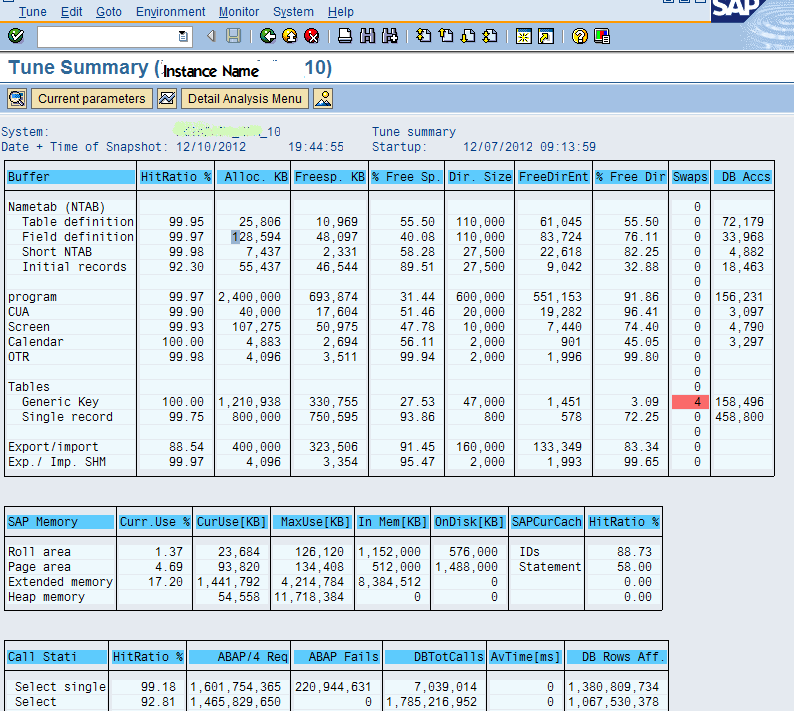
You can refresh the screen to show new status, Except Curr. Use and MaxUse, all other non-configuration data are accumulated data since last startup of the SAP instance in question.
1.2. How to navigate through important screens of the SAP ST02 transaction
Following screen shows menu path and hot key which you can use to access other SAP ST02 screens:

1.2.1. How to review SAP buffer and memory for another instance of the SAP system
If your system has more than one instance, you can display to another instance via following path from Figure-1 screen: Environment -> RFC server or press shift+F4 key until a popup window shows up with a list of instance, you can click the one you would like to review.
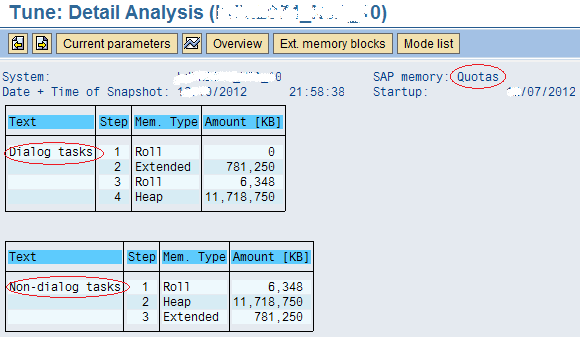
1.2.2. How to navigate to SAP Quotas screen – SAP Memory allocation for a single work process
SAP ST02 Quota screen shows type of memory and amount allowed for a single SAP work process as well as memory allocation sequence. There are two sequences – one is for dialog type tasks like online transaction executed by a SAP user, the other is for non-dialog tasks like SAP SM37 jobs.
You can get the memory quota screen for single sap work process via menu Goto->SAP memory-> Quotas:
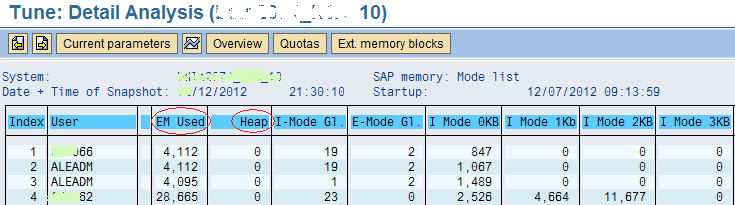
1.2.3. How to navigate to mode list screen showing Memory usage at user/transaction level
You can bring up mode list screen from main screen (Figure 1) via following path: Details analysis menu -> SAP Memory -> Mode list
1.2.4. How to navigate to SAP Memory history screen
SAP ST02 provides you history memory usage information. You can access this information via following menu path or hot keys from the memory initial screen.
![]()
Following is a part of history screen :
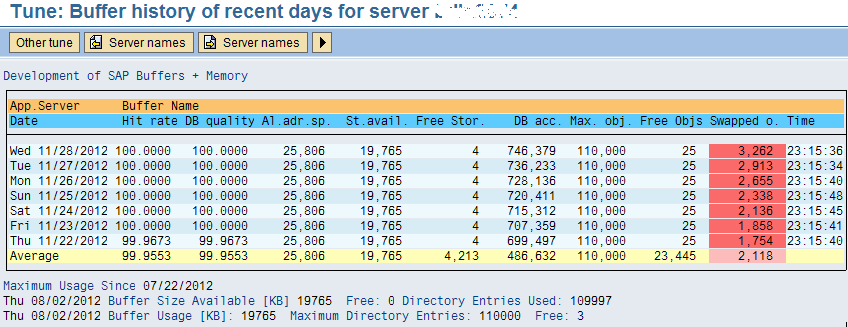
If you are just interested in buffer history for one buffer type, you can double click the corresponding row in Figure-1 screen –the screen would change, on the new screen click on History Icon, SAP ST02 would bring up history screen just for the selected buffer type.
History information can reveal abnormal memory usage as well as high-water mark namely “Maximum Usage” since the date when instance is started or restarted. SWAP difference between two dates can show the growth pattern –base on that, you can see whether action is needed to correct the situation.
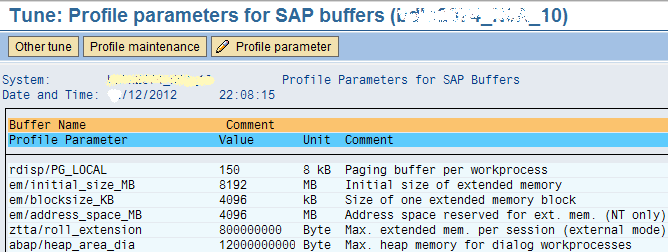
1.2.5. How to navigate to parameter screen
You can check SAP memory/buffer parameters via Icon or following the menu path: Goto-> Profile Parameters -> Current.
Following is a part of SAP memory/buffer parameter screen: